RENTALS AND SALES LISTINGS CONTINUE TO HEAD NORTH

By Edwin Almeida
November 6, 2018

Rental listings numbers and sales listing numbers, continue to head north. Both the high vacancies and increasing amount of new dwellings being completed, are placing a huge amount of pressure on investors, and others wanting to exit the market.
It is my observation, that many investors being forced to settle, due to completion of their off-the-plan purchase, are making a bet both ways. Try and resell the recently settled property and at the same time, try to rent it out. The longer the property is vacant, the greater the pressure on the property owner.
The above scenario, is just one of the many reasons we are seeing a growth in numbers on both sides of the ledger. I have previously written about other scenarios.
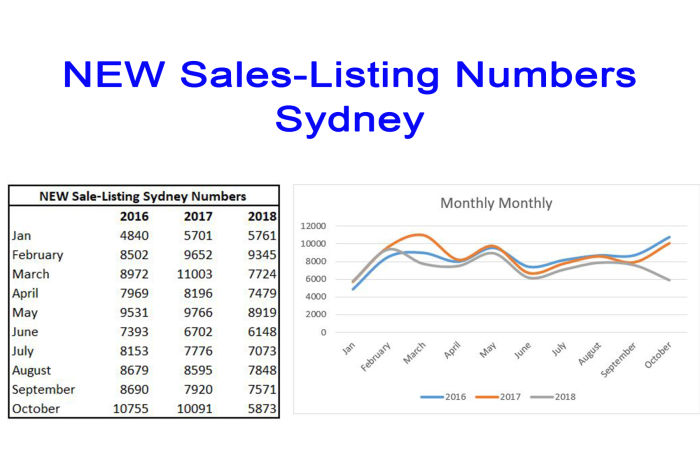
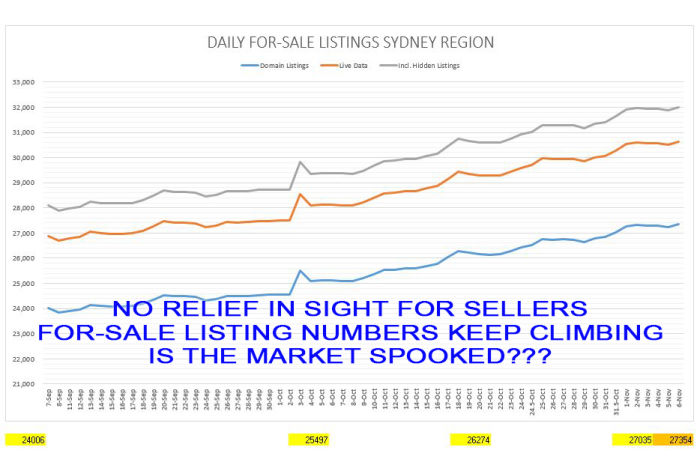
Although, NEW sales-Listing numbers have been lower than in the previous two years, as noted in the graph below. The growth in the amount of days on market, has bolstered the LIVE sales-numbers on a week by week basis (Daily For-Sale Listings Sydney - Third graph found bottom of article).
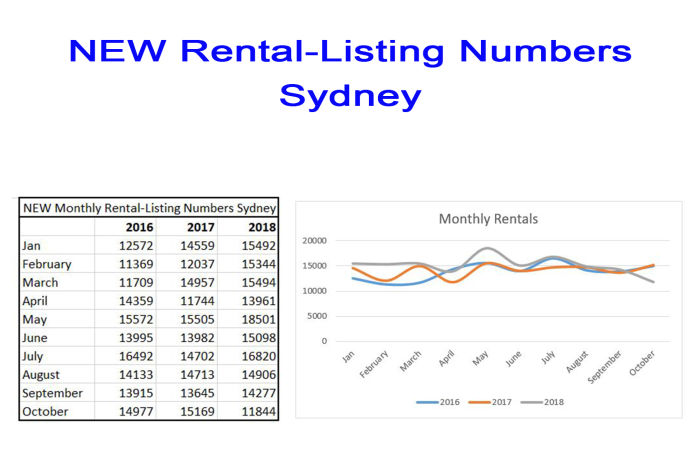
Rentals on the other hand, tracked significantly higher than the previous two years. All due to the high levels of high-rise development completion and medium density. Compounding pressure on property managers and owners.
Adding to the above numbers, are the extended days on market, in the rental sector. A similar phenomenon experienced in the sale of property arena.
October has been a little more forgiving, in relation to NEW rental-listings appearing in Sydney. A small, but nonetheless, welcomed relief for investors.
On the other hand, October hasn’t been as kind, to owners looking to sell. We have mapped a larger volume of LIVE for-sale properties, on the market, in the Sydney Region. The rise in numbers are charted in the graph below.
Notwithstanding, more and more dwellings are coming to completion. High rise, medium density, duplexes and even granny-flat developments. All adding and compounding the problem, investors and property owners face.
Were it all continues to go, in 2019, will be an interesting scenario. I will have more data to share in weeks to come. Data that will help us map out both – likely falls in rents and more to the point, increased percentage rate of falls in the property price arena.
One thing for sure, and I continue to stress; all this is playing out on VERY-LOW rates. Furthermore, 2019 is really the litmus test, to see how IO investors will deal with loan changes.
Personally, I do not foresee much relief over December and early January. I will continue to say, the pressure on both rentals and sales, will be greater. We may soon see, drops in property prices, in the 2 percent and even 5 percent brackets, on a per month basis, in parts of Sydney and surrounding towns. Newcastle and Wollongong, as well as Gosford and the Central Coast.
Simple economics - supply and demand among other factors, is a catalyst that was overlooked. Perhaps even understated. One simple contributor to what we are facing now, one which, the main stream analysts told us so adamantly, wasn't true. This little issue is called over-supply.
Once again, a BIG thank you to Estate Agents Co-Operative, for the great work they do and for sharing their data. As always, feel free to reach out for assistance on anything property related - edwin@ribbonproperty.com.au.